Democracy, elections, ballot, and voting
By Leah Dearborn
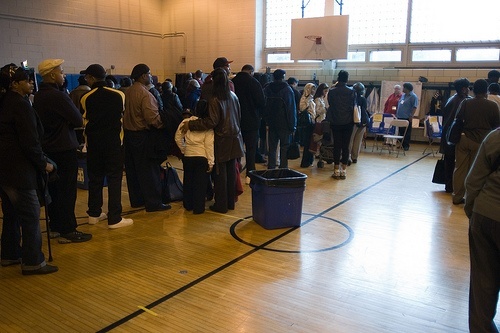
A recent study conducted by MIT illuminates many problems with voting lines and needed election infrastructure. The research paper released earlier this month by the MIT Political Science Department takes a closer look at how much time American voters are spending in line at the polls. The study conducted by Professor Charles Stewart III, begins:
The length of time waiting to vote has regularly been an issue in the voting wars of the past decade. Long lines have given both the left and the right heartburn. For the left, long lines can be evidence that service-starved neighborhoods of predominantly poor and minority voters are seeing their votes suppressed through the inadequate provisioning of voting machines and poll workers on Election Day. For the right, the sight of long lines are just an excuse used by Democratic lawyers to get polling hours extended in urban areas, solely for the benefit of Democratic candidates.
As many Americans can surely attest to, not all polling places are made equal. According to Stewart, Floridians waited an average of 40 minutes, while Vermonters waited 2 or less. Alarmingly, race also appears to factor heavily into many voters’ wait time. Across the board, minorities are spending more time waiting in line than their white counterparts. The study examines the issue on both an individual and aggregate level:
Viewed nationally, African Americans waited an average of 23 minutes to vote, compared to 12 minutes for whites; Hispanics waited 19 minutes. While there are other individual-level demographic difference present in the responses, none stands out as much as race…Aggregate demographic factors show many of the same patterns. Residents of ZIP codes with more than 75% nonwhite population waited an average of 24 minutes to vote, compared to residents of ZIP codes with less than 25% nonwhite population, who waited 11 minutes on average.
Stewart comments that the gap between minority and non-minority vote times likely has more to do with where minorities live, rather than any discrimination on a individual basis. When analyzed, he found that white voters living in zip codes with a 50 percent or higher minority population experienced almost no difference in wait time.
Leave a Reply